It has recently been uncovered, that a NOAA scientist, Dr. Richard A. Feely, who is a senior scientist with the Pacific Marine Environmental Laboratory (PMEL), which is part of the National Oceanic and Atmospheric Administration (NOAA) used “cherry-picked” data in testimony before Congress in 2010.
The story was broken by Marita Noon, executive director for Energy Makes America Great Inc in an article at Cfact here. The story was reposted and amplified on WattsUpWithThat. Read those posts for greater detail.
Here is what happened:
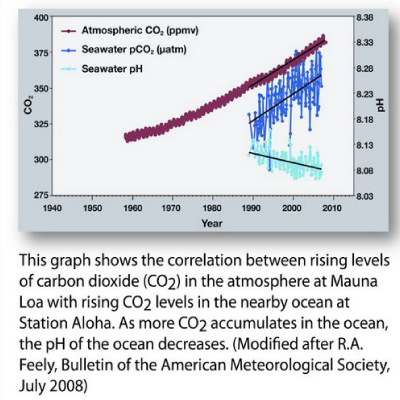
In Congressional testimony, Feely presented a graph similar to the one below which implied great danger from ocean acidification as our atmospheric concentration of carbon dioxide rises.
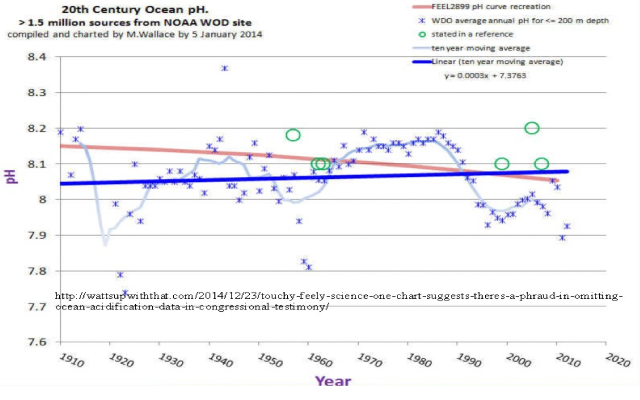
According to Noon, this graph piqued the interest of Mike Wallace, a hydrologist with nearly 30 years’ experience, who is now working on his Ph.D. in nanogeosciences at the University of New Mexico. Wallace noticed that Feely’s graph omitted 80 years of data, which incorporate more than 2 million records of ocean pH levels.
Wallace corresponded with Feely and his co-author, Dr. Christopher L. Sabine, another NOAA scientist. This correspondence was unfruitful, but during the long process, NOAA reissued its World Ocean Database. Wallace was then able to extract the instrumental records he sought and turned the data into a meaningful time series chart, which reveals that the oceans are not acidifying. Here is Wallace’s graph:
The purposely omitted data gave Congress a false picture of what is really happening.