

A new study presented by meteorologist Anthony Watts (proprietor of the Watts Up With That blog) at the 2015 Fall Meeting of the American Geophysical Union “suggests that the 30-year trend of temperatures for the Continental United States (CONUS) since 1979 are about two thirds as strong as officially [published] NOAA temperature trends.” That means official temperatures publicized by the National Oceanic and Atmospheric Administration (NOAA) are 50% too high. (See full post)
Using NOAA’s U.S. Historical Climatology Network, which comprises 1218 weather stations in the CONUS, the researchers were able to identify a 410 station subset of “unperturbed” stations that have not been moved, had equipment changes, or changes in time of observations, and thus require no “adjustments” to their temperature record to account for these problems. The study focuses on finding trend differences between well sited and poorly sited weather stations, based on a WMO approved metric… for classification and assessment of the quality of the measurements based on proximity to artificial heat sources and heat sinks which affect temperature measurement.
This new study is a follow-up to a study published in 2010 entitled “Analysis of the impacts of station exposure on the U.S. Historical Climatology Network temperatures and temperature trends” [link to paper] That paper concluded:
Temperature trend estimates vary according to site classification, with poor siting leading to an overestimate of minimum temperature trends and an underestimate of maximum temperature trends, resulting in particular in a substantial difference in estimates of the diurnal temperature range trends.
The map below, from the new study compares mean temperature trends from compliant class 1&2 weather stations (top left) with non-compliant class 3, 4, and 5 stations (bottom left) and with the map NOAA published (right). You will notice on the non-compliant and NOAA maps, the southwest has highly increasing temperature trends. Maybe that is why certain UofA professors keep claiming that the Southwest is “ground zero” for climate change.
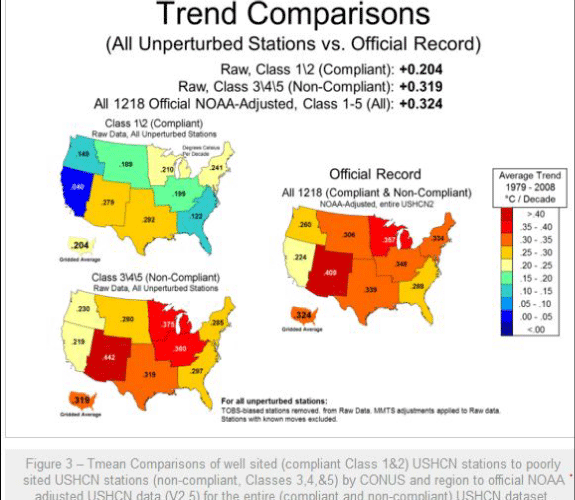
Results from the compliant stations are similar to results from NOAA’s other network of modern stations, the U.S. Climate Reference Network which has been in operation for about 11 years. NOAA doesn’t mention this network and does not distinguish its separate results in the compilation shown above. See my ADI story: New NOAA data show cooling trend for last 10 years. When a certain year is proclaimed the hottest ever, remember it depends on who is doing the measurements.
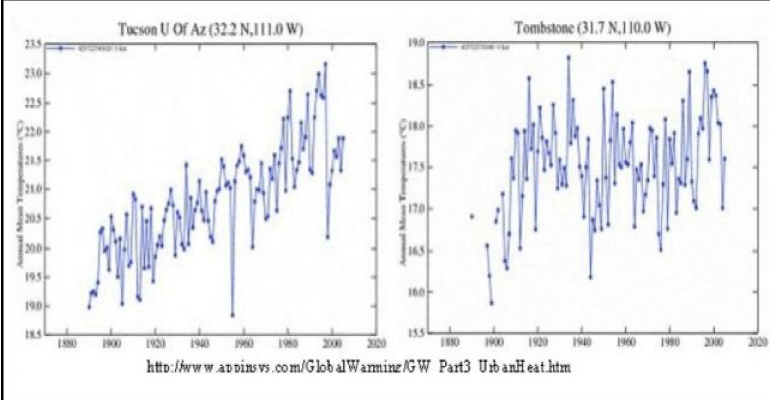
For a local example of results from a non-compliant station versus a compliant station, compare the temperature trends of the Tucson USHCN station (now non-compliant) with that of Tombstone. Both graphs show the temperature trends from 1890 through 2010. Tucson’s increasing temperature is due to the Urban Heat Island effect, i.e., our concrete and asphalt absorb heat during the day and make both days and nights warmer.
It appears to me that NOAA scientists (and those in other federal agencies) are purposely manipulating the data to conform to a political agenda. Such is the sad state of “climate science.”
We have heard and probably will hear again that 2015 is the hottest year ever, but real data such as that compiled by Tony Heller (see here) shows that “2015 Was One Of The Coolest Years On Record In The US.”
Related:
The Bankruptcy of Climate Science
Note to readers: I have constructed a linked index to more than 300 of my ADI articles. You can see it at: https://wryheat.wordpress.com/adi-index/
You can read my comprehensive, 28-page essay on climate change here: http://wp.me/P3SUNp-1bq
Note to readers: I have constructed a linked index to more than 300 of my ADI articles. You can see it at: https://wryheat.wordpress.com/adi-index/
You can read my comprehensive, 28-page essay on climate change here: http://wp.me/P3SUNp-1bq