

The National Oceanic and Atmospheric Administration (NOAA) maintains an official temperature record for the United States through its network of weather stations called the U.S. Historical Climatology Network (USHCN). There are many problems with this network including instrumental errors and siting in or near urban areas which subject the stations to the artificial warming of the urban heat island effect.
A local example of change in site conditions is illustrated by the USHCN station on the campus of the University of Arizona. The photo to the right shows how it looked in 1923 – in a relatively vegitated open area . The more recent second photo below shows how the station is now surrounded by buildings, asphalt streets and parking lots. The site change is the main reason why the station reports warmer temperatures than in the past.
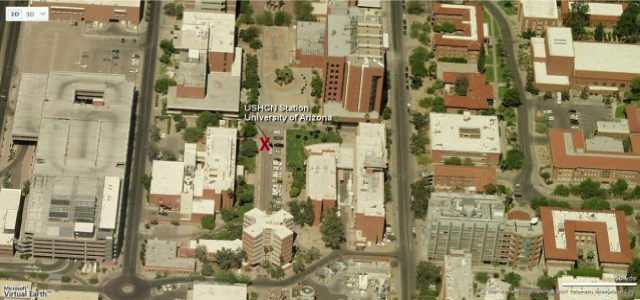
University of Arizona weather station 2007
The official temperatures reported by the National Weather Service currently come from a station at Tucson airport which is, itself, surrounded by concrete and asphalt.
NOAA has also established a parallel set of weather stations, operating for about 10 years now, that address the many problems of the USHCN. That network is the United States Climate Reference Network (USCRN). These are modern stations, sited well away from urban influence, that use state of the art instrumentation and are therefore not subject to many of the problems associated with the old USHCN network.
NOAA has just released the data from the 114 stations of the new USCRN. The difference in temperatures recorded by the two networks shows that the old USHCN has been overstating the temperature anywhere from +0.5°C on average, up to almost +4.0°C (+0.9°F to +7.2°F) in some locations during the summer months. Remember that when you see headlines blaring that a certain day, week, month, year was the warmest since…. whenever. The new USCRN data is more in line with the satellite temperature record.
The following graph is a temperature anomaly plot from the new network (Fahrenheit on left scale, Celsius on right). There have been heat waves and cold spells, but the overall trend is one of cooling for the past 10 years.
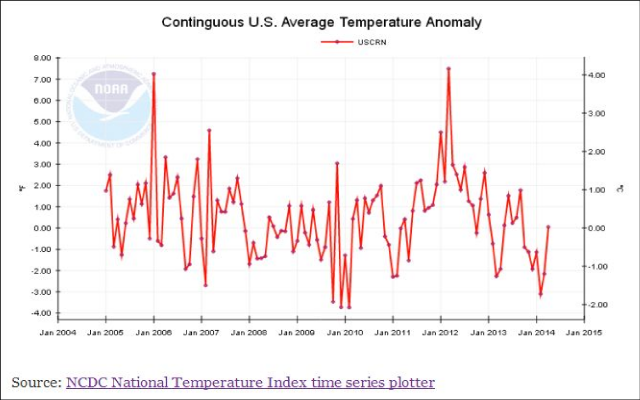
Plots of maximum temperatures and minimum temperatures also show a cooling trend.
Anthony Watts has a long post with detailed explanations and nice graphics on his WUWT blog.
The point here is that much of the “global warming” reported in the media is an artifact of spurious temperatures from an obsolete network of weather stations.
P.S. Do you think you will ever see this story in the Arizona Daily Star?
See also on ADI:
Arizona Daily Star alarmed that Arizona summers are hot
On Wryheat, see articles about the old USHCN network and “adjustments” made to its data:
NOAA Temperature Record “Adjustments” Could Account for Almost All “Warming” since 1973