For years, many have watched as the leaders in Pima County dole out the proverbial fish to residents and deny them the proverbial fishing poles. Practices like social promotion passed as compassion, while business killing ordinances were passed by august chambers.
The toll on children is rarely discussed except when politicians are trying to pass blame or justify another tax hike. The true toll on children has never before been revealed until now.
According to an article in the New York Times, The Best and Worst Places to Grow Up: How Your Area Compares, “Pima County is very bad for income mobility for children in poor families. It is better than only about 5 percent of counties.”
The Times article refers to a new study by Raj Chetty and Nathaniel Hendren. Their Equality of Opportunity Project, used “big data” for their study; The Causal Effects of Growing up in Different Counties on Earnings in Adulthood.
Their findings were based on “both in a national quasi-experimental study of five million families and in a re-analysis of the Moving to Opportunity Experiment.” The researchers used a “new methodology and data to present estimates of the causal effect of each county in America on upward mobility.” As a result, they reveal not only “which counties merely correlate well with income mobility,” but which counties “might actually cause it.”
When the researchers “focused on families who moved across areas to study how neighborhoods affect upward mobility,” they discovered that every year of exposure to a better environment improves a child’s chances of success.”
In the case of Pima County, the longer a child lives in the area the fewer chances they have for success. In fact, according to the research, children who move out of Pima County “at earlier ages are less likely to become single parents, more likely to go to college and more likely to earn more.”
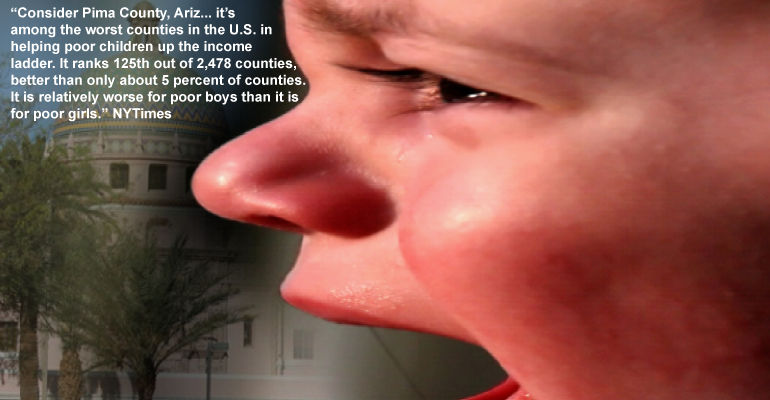
According to the Times article, Pima County is “among the worst counties in the U.S. in helping poor children up the income ladder. It ranks 125th out of 2,478 counties, better than only about 5 percent of counties. It is relatively worse for poor boys than it is for poor girls.”
Growing up in Maricopa County increases a child’s future prospects while growing up in Pima County decreases them. The difference – spread over a lifetime of work – is huge, and should be unacceptable.
The researchers found five factors associated with strong upward mobility:
● less segregation by income and race
● lower levels of income inequality
● better schools
● lower rates of violent crime
● larger share of two-parent households
The researchers conclude that “social mobility should be tackled at a local level.”
That makes sense since the damaging decisions have been made by local leaders, who would rather offer charity rather than opportunity. Time and time again, the leadership rejects reforms like ending social promotion in the area’s largest school district (TUSD), and new high-wage paying businesses like Grand Canyon University and Rosemont Mine.
The decisions they make are not necessarily those their constituents desire, but the apathy and learned helplessness of the populace has guaranteed that little will change. Like abused children, they have learned to be quite and complacent. As a result, they settle for handouts while their kids are denied a hand up.
How Pima County ranks among places in the Tucson area
| County | Poor boys | Poor girls | Average boys | Average girls | Rich boys | Rich girls | Richest boys | Richest girls | Median rent |
| Santa Cruz | 1st | 2nd | 2nd | 3rd | 2nd | 3rd | 3rd | 3rd | $529 |
| Cochise | 2nd | 1st | 1st | 1st | 1st | 1st | 1st | 1st | $523 |
| Pima | 3rd | 3rd | 3rd | 2nd | 3rd | 2nd | 2nd | 2nd | $635 |
How Maricopa County ranks among places in the Phoenix area
| COUNTY | POOR BOYS | POOR GIRLS | AVERAGE BOYS | AVERAGE GIRLS | RICH BOYS | RICH GIRLS | RICHEST BOYS | RICHEST GIRLS | MEDIAN RENT |
| Maricopa | 1st | 1st | 2nd | 1st | 2nd | 1st | 2nd | 2nd | $781 |
| Gila | 2nd | 2nd | 1st | 2nd | 1st | 2nd | 1st | 1st | $525 |
| Pinal | 3rd | 3rd | 3rd | 3rd | 3rd | 3rd | 3rd | 3rd | $549 |
What a Childhood in Pima County Does to Future Income
| Future Income | INCOME CHG. | NAT. PCT. |
| For all poor kids | -$3,170 | 5% |
| For all poor boys | -$5,650 | <1% |
| For all poor girls | -$10 | 42% |
| For all average-income kids | -$3,010 | 2% |
| For average-income boys | -$4,730 | 1% |
| For average-income girls | -$840 | 21% |
| For all rich kids | -$2,570 | 3% |
| For rich boys | -$3,350 | 2% |
| For rich girls | -$1,640 | 10% |
| For all kids in the top 1% | -$1,950 | 7% |
| For boys in the top 1% | -$1,850 | 11% |
| For girls in the top 1% | -$2,210 | 8% |
Related articles:
TUSD’s social promotion policy perpetuates fraud on community
DOJ questions TUSD Special Master’s plan
