

Dr John Bates, a recently retired senior scientist at the National Oceanic and Atmospheric Administration (NOAA), alleges that a NOAA paper written before the historic climate conference in Paris in 2015 breached NOAA’s own rules and was based on misleading and unverified data. That, to many, looks like the paper was designed to stoke up hysteria over global warming in the run-up to the conference. (Source)
NOAA has often been accused of manipulating data for political purposes. See for instance, my ADI article: The past is getting cooler which reflects a curiosity of published government temperature records that show the 1930s getting cooler and cooler with each update of the record. The more recent scandal derives from NOAA’s attempt to erase the 18-year “pause” in global warming. Even though atmospheric carbon dioxide has been rising, global temperature has failed to respond as the climate models say it should. (See El Nino to El Nino – no warming of global temperature) This recent scandal was exposed by David Rose in an article in the British paper Daily Mail.
Global temperatures published by NOAA compared to global temperatures published by the British MET office shows that NOAA temperatures are consistently higher. In the graph below (source), the red line shows the current NOAA world temperature graph, which relies on the ‘adjusted’ and unreliable sea temperature data cited in the flawed ‘Pausebuster’ paper. The blue line is the UK Met Office’s independently tested and verified ‘HadCRUT4’ record, showing lower monthly readings and a shallower recent warming trend.
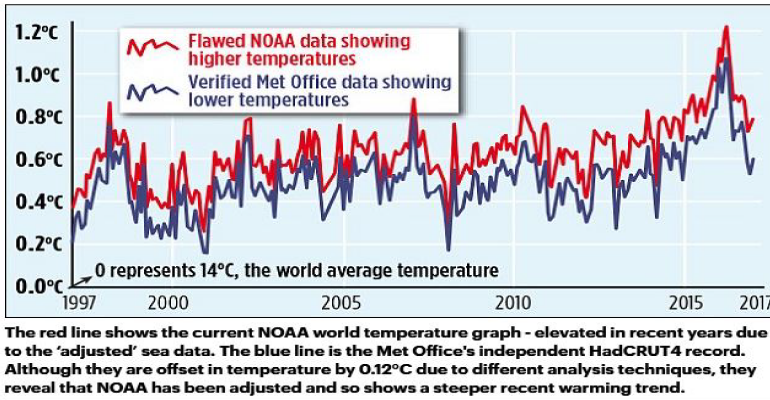
David Rose notes: NOAA’s 2015 ‘Pausebuster’ paper was based on two new temperature sets of data – one containing measurements of temperatures at the planet’s surface on land, the other at the surface of the seas. Both datasets were flawed. This newspaper has learnt that NOAA has now decided that the sea dataset will have to be replaced and substantially revised just 18 months after it was issued, because it used unreliable methods which overstated the speed of warming. The revised data will show both lower temperatures and a slower rate in the recent warming trend. The land temperature dataset used by the study was afflicted by devastating bugs in its software that rendered its findings ‘unstable’.
To add to the confusion, NOAA also changed the computer programs it uses to compile temperature data, and guess what? The new program creates global warming where there had been none before. These changes are documented in a post by Rud Istvan.
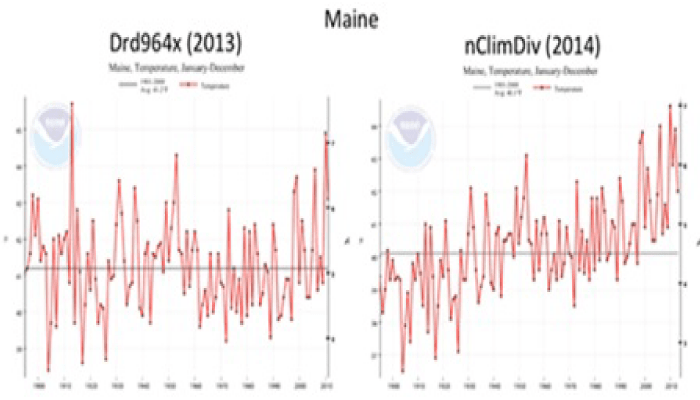
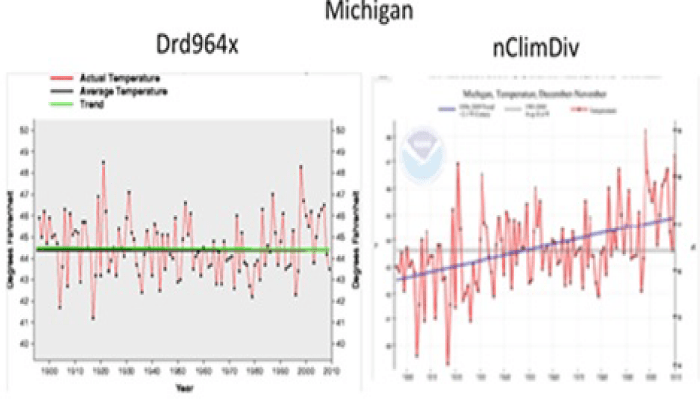
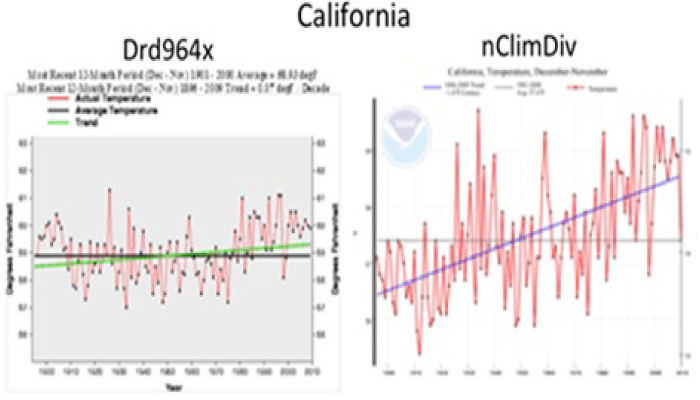
“A 2011 paper announced that NOAA would be transitioning to updated and improved CONUS software around the end of 2013. The program used until the upgrade was called Drd964x. The upgrade was launched from late 2013 into 2014 in two tranches. Late in 2013 came the new graphical interfaces, which are an improvement. Then about February 2014 came the new data output, which includes revised station selection, homogenization, and gridding. The new version is called nClimDiv.” The graphs below show some of the results for temperatures from 1900 to 2010. Left shows old system results versus new system results on right.
Another way NOAA influences the official temperature is by removal of thousands of weather station land thermometers from remote, high altitude, and/or non-urban locations since the 1970s. These are stations which do not show the warming trends predicted by models, as they are not affected by proximity to artificial or non-climatic heat sources (pavements, buildings, machinery, industry, etc.) like urban weather stations are. (Thermometers near urban heat sources can cause warming biases of between 0.1 and 0.4°C per decade.) This inflates the average temperature reported. Read more
Perhaps the Trump administration can get NOAA out of politics and back to science.
Note to readers:
- Index with links to all my ADI articles: http://wp.me/P3SUNp-1pi
- Search that index for many more stories of NOAA’s naughtiness.
- My comprehensive 28-page essay on climate change: http://wp.me/P3SUNp-1bq
- A shorter ADI version is at https://arizonadailyindependent.com/2013/08/01/climate-change-in-perspective/