

Climate alarmists put forth scary scenarios saying that carbon dioxide induced global warming is causing unprecedented and accelerating sea level rise which will drown our coastal cities and wipe out South Pacific Islands.
Measuring sea level is more complicated than pounding a stake into a beach. Sea level and the rate of rise or fall are subject to daily and seasonal variations, storm surges, and effects from decadal to multi-decadal oscillations such as El Niño. For instance, the west-blowing equatorial trade winds can pile up an extra foot of water in the western Pacific compared to the eastern Pacific. There are also tectonic events: is the ocean rising or is the land sinking? Pumping groundwater causes soil compaction and hence sinking land. Another complication: isostatic rebound of North America is tipping the northeast coast into the sea. (For a more detailed explanation of glacial isostacy see here.)
Let’s start with the big picture. Since the end of the last glacial epoch, global sea level has risen 120 meters (393 feet), about one meter per century. Most of that was the result of melting of continental ice sheets between 18,000 and 8,000 years ago. The rate of sea level rise has leveled off to about 1- to 3 millimeters per year(1 foot per century), about the thickness of two pennies.

Several recent studies show what is happening now:
Larsen and Clark (2006) studied the rate of sea level rise for the past 6,000 years, based on geologic evidence and the historic record. The researchers found that there has been no acceleration of sea level rise in response to increased temperature or CO2 levels.
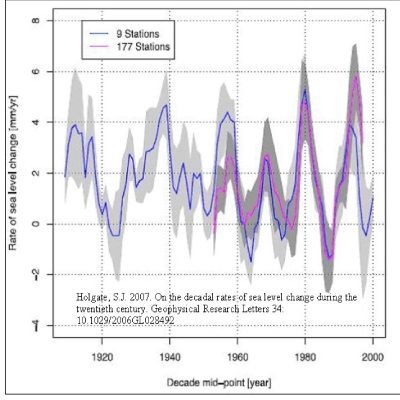
Holgate (2007), using data from worldwide coastal tidal gauge records, shows that the rate of sea level rise is cyclical, but decreasing over the period studied. Specifically, the mean rate of global sea level rise was “larger in the early part of the last century (2.03 ± 0.35 mm/yr 1904-1953), in comparison with the latter part (1.45 ± 0.34 mm/yr 1954-2003).”
Satellite measurement of the rate of sea level rise is reported at 3.2±0.4 mm/yr versus Holgate’s value of 1.45 mm/yr. It just so happens that satellite measurement started at the bottom of a cycle, thereby giving a false impression of the overall rate of rise. Because the rate of sea level rise is cyclical, it is easy to cherry-pick time intervals to suit an agenda.
Holgate does not address possible causes of the rate cycle. However, Kolker and Hameed (2007), report “a major fraction of the variability and the trend in mean sea level at key sites along the Atlantic Ocean are driven by shifts in the position and intensity of the major atmospheric pressure centers that reside over the Atlantic Ocean, the Azores High and the Icelandic Low,” which they refer to as atmospheric centers of action. Apparent sea level is also affected by variability of storms, winds, floods, waves, shifts in major ocean currents, volcanically-induced ocean heat content variations, the El Niño Southern Oscillation, subsidence, uplift, tectonics, and freshwater fluxes.
Houston and Dean (2011) analyzed the records of 57 U.S. tidal gauges for the period 1930 to 2010. They found “almost a balance with 30 gauge records showing deceleration and 27 showing acceleration, clustering around 0.0 mm/y. The mean is a slight deceleration of -0.0014 mm/yr.
In more recent research, Scafetta (2013), studied six long-term tidal gauge records sited to represent all of the world’s oceans. He found the rate of sea level rise “…to be characterized by significant oscillations at the decadal and multidecadal scales up to about 110-year intervals. Within these scales both positive and negative accelerations are found if a record is sufficiently long. This result suggests that acceleration patterns in tide gauge records are mostly driven by the natural oscillations of the climate system. The volatility of the acceleration increases drastically at smaller scales such as at the bi-decadal ones.”
“Tide gauge accelerations oscillate significantly from positive to negative values mostly following the PDO, AMO and NAO oscillations. In particular, the influence of a large quasi 60–70 year natural oscillation is clearly demonstrated in these records.”
A conclusion from the Scafetta paper has implications for climate model predictions: “at scales shorter than 100-years, the measured tide gauge accelerations are strongly driven by the natural oscillations of the climate system (e.g. PDO, AMO and NAO). At the smaller scales (e.g. at the decadal and bi-decadal scale) they are characterized by a large volatility due to significant decadal and bi-decadal climatic oscillations. Therefore, accelerations, as well as linear rates evaluated using a few decades of data (e.g. during the last 20-60 years) cannot be used for constructing reliable long-range projections of sea-level for the twenty first century.”
About those South Pacific Islands:
You may recall several years ago much press about Tuvalu and other South Pacific islands being endangered by rising sea level. For an example of some of the hype, see my October, 2011, post: “University of Arizona Dances with Sea Level.”
The Australian government has been monitoring sea level on Pacific islands with modern instruments since 1992. In the case of Tuvalu, they state, “If the depression of the 1998 cyclone is ignored, there was no change is sea level at Tuvalu between 1994 and 2009: 14 years. (See report of studies by Vincent Gray here.)
Finally, new research by Kench et al. (2015) finds that these same South Pacific islands, rather than sinking beneath the waves, have in fact been growing. Here is the abstract from their paper:
“The geological stability and existence of low-lying atoll nations is threatened by sea-level rise and climate change. Funafuti Atoll, in the tropical Pacific Ocean, has experienced some of the highest rates of sea-level rise (~5.1 ± 0.7 mm/yr), totaling ~0.30 ± 0.04 m over the past 60 yr. We analyzed six time slices of shoreline position over the past 118 yr at 29 islands of Funafuti Atoll to determine their physical response to recent sea-level rise. Despite the magnitude of this rise, no islands have been lost, the majority have enlarged, and there has been a 7.3% increase in net island area over the past century (A.D. 1897–2013). There is no evidence of heightened erosion over the past half-century as sea-level rise accelerated. Reef islands in Funafuti continually adjust their size, shape, and position in response to variations in boundary conditions, including storms, sediment supply, as well as sea level. Results suggest a more optimistic prognosis for the habitability of atoll nations and demonstrate the importance of resolving recent rates and styles of island change to inform adaptation strategies.” Source
In other words, the slow rise of 1- to 2 mm per year in global sea level is an artifact of our current interglacial period. Local sea level rise or fall depends on local geology, the amount of groundwater pumping in coastal areas, and the cyclic weather patterns. It has nothing to do with carbon dioxide emissions.
But be warned: “Civilization exists by geological consent, subject to change without notice.” -Will Durant
References;
Holgate, S.J. 2007. On the decadal rates of sea level change during the twentieth century. Geophysical Research Letters 34: 10.1029/2006GL028492
Houston, J.R. and Dean, R.G., 2011. Sea-level acceleration based on U.S. tide gauges and extensions of previous global-gauge analyses. Journal of Coastal Research, 27(3), 409–417. West Palm Beach (Florida), ISSN 0749-0208. (Source)
Kench et al., 2015, Coral islands defy sea-level rise over the past century: Records from a central Pacific atoll, Geological Society of America, in Geology Magazine, March 2015. (Source)
Kolker, A.S. and Hameed, S. 2007. Meteorologically driven trends in sea level rise. Geophysical Research Letters 34: 10.1029/2007GL031814
Larsen, C.E. and Clark, I. 2006. A search for scale in sea-level studies. Journal of Coastal Research 22: 788-800.
Scafetta, N., 2013, Multi-scale dynamical analysis (MSDA) of sea level records
versus PDO, AMO, and NAO indexes, Climate Dynamics, DOI 10.1007/s00382-013-1771-3.
See the full paper here.
See also:
The Myth of Ocean Acidification by Carbon Dioxide
Failure of climate models shows that carbon dioxide does not drive global temperature
Some basic facts on carbon dioxide and climate
What keeps Earth warm – the greenhouse effect or something else?