

The U.S. Global Change Research Program (USGCRP) has just released the final version of its Fourth National Climate Assessment report, one that many were claiming that the Trump administration would suppress because, like its predecessors, it is mainly a political document rather than a true scientific assessment . You can read the full 477-page report here: https://science2017.globalchange.gov/
The main conclusion is: “This assessment concludes, based on extensive evidence, that it is extremely likely that human activities, especially emissions of greenhouse gases, are the dominant cause of the observed warming since the mid-20th century.”
The “extensive evidence” is based entirely on climate modeling rather than on observations. The results produced by models diverge widely from reality. The new report makes the same claims and invokes the same junk science as the previous 2014 report which I analyzed here: National Climate Assessment Lacks Physical Evidence.
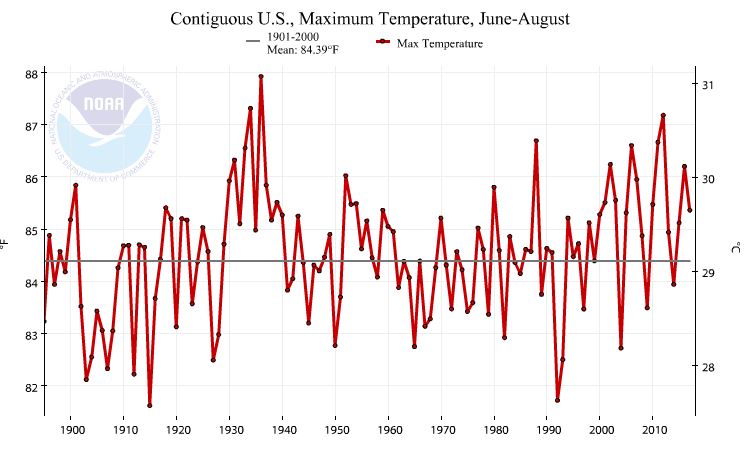
As an example of unfounded claims made in the new report we see this statement in the executive summary: “Heatwaves have become more frequent in the United States since the 1960s, while extreme cold temperatures and cold waves are less frequent.”
But plots from the EPA and NOAA show that the most intense heat waves occurred in the 1930s.

 Another example:
Claim in the report: “The incidence of large forest fires in the western United States and Alaska has increased since the early 1980s and is projected to further increase in those regions as the climate changes, with profound changes to regional ecosystems.” This statement is technically correct but it represents cherry-picking and lying by omission.
The National Interagency Fire Center has a table listing the number of fires and acreage burned from 1960 through 2016 (see: https://www.nifc.gov/fireInfo/fireInfo_stats_totalFires.html ).
We see from the table that there were 18,229 fires reported in 1983 which increased to 67,743 fires reported in 2016. What the report doesn’t mention is that the number of fires from 1960 to 1982 were all in the six figure range, e.g., in 1960 there were 103,387 fires and in 1981 there were 249,370 fires. The number dropped to 174,755 fires in 1982.
Fire frequency does not necessarily increase with warming. In many parts of the world, fire frequency decreases with warming. See my post “Wildfires And Warming – It’s Complicated”
A third example of unfounded claims: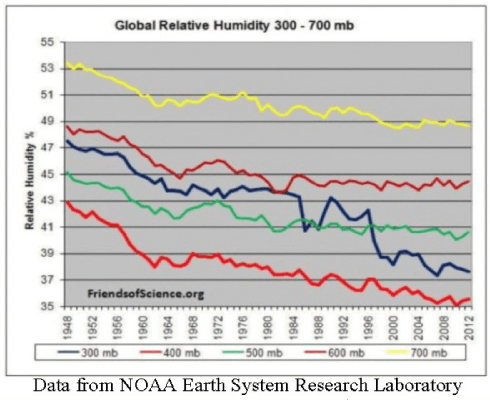
Section 2.6.1 of the report discusses the “greenhouse effect.” They claim: “As increasing GHG [greenhouse gases] concentrations warm the atmosphere, tropospheric water vapor concentrations increase, thereby amplifying the warming effect.” Climate models depend on this assumption. But NOAA’s own data show that global humidity has been decreasing with warming.
Comments by others:
- Theoretical physicist Steve Koonin has an op-ed in the Wall Street Journal entitled “A Deceptive New Report on Climate.”
- Koonin was undersecretary of energy for science during President Obama’s first term and is director of the Center for Urban Science and Progress at New York University. The WSJ article is pay-walled but you can read extensive excerpts here.
Among his comments:
One notable example of alarm-raising is the description of sea-level rise, one of the greatest climate concerns. The report ominously notes that while global sea level rose an average 0.05 inch a year during most of the 20th century, it has risen at about twice that rate since 1993. But it fails to mention that the rate fluctuated by comparable amounts several times during the 20th century. The same research papers the report cites show that recent rates are statistically indistinguishable from peak rates earlier in the 20th century, when human influences on the climate were much smaller. The report thus misleads by omission.
Note: The rate of sea level rise and fall tends to be cyclical on decadal and bi-decadal periods. See my article: The Sea Level Scam.
Koonin also comments on heat waves: The report’s executive summary declares that U.S. heat waves have become more common since the mid-1960s, although acknowledging the 1930s Dust Bowl as the peak period for extreme heat. Yet buried deep in the report is a figure [6.3] showing that heat waves are no more frequent today than in 1900.
Comments by Dr. Patrick J. Michaels, director of the Center for the Study of Science at the Cato Institute, past president of the American Association of State Climatologists, and former program chair for the Committee on Applied Climatology of the American Meteorological Society. He was a research professor of Environmental Sciences at University of Virginia for 30 years. Read full post “What You Won’t Find in the New National Climate Assessment.”
Under the U.S. Global Change Research Act of 1990, the federal government has been charged with producing large National Climate Assessments (NCA), and today the most recent iteration has arrived. It is typical of these sorts of documents–much about how the future of mankind is doomed to suffer through increasingly erratic weather and other tribulations. It’s also missing a few tidbits of information that convincingly argue that everything in it with regard to upcoming 21st century climate needs to be taken with a mountain of salt.
The projections in the NCA are all based upon climate models. If there is something big that is systematically wrong with them, then the projections aren’t worth making or believing.
The report does not tell you that:
1) Climate model predictions of global temperature diverge widely from observations.
2) No hot spot over tropics: The models predict that there should have been a huge “hot spot” over the entire tropics, which is a bit less than 40% of the globe’s surface. Halfway up through the atmosphere (by pressure), or at 500 hPa, the predicted warming is also twice what is being observed, and further up, the prediction is for seven times more warming than is being observed.
The importance of this is paramount. The vertical distribution of temperature in the tropics is central to the formation of precipitation.
Missing the tropical hot spot provokes an additional cascade of errors. A vast amount of the moisture that forms precipitation here originates in the tropics. Getting that wrong trashes the precipitation forecast, with additional downstream consequences, this time for temperature.
When the sun shines over a wet surface, the vast majority of its incoming energy is shunted towards the evaporation of water rather than direct heating of the surface. This is why in the hottest month in Manaus, Brazil, in the middle of the tropical rainforest and only three degrees from the equator, high temperatures average only 91 F (not appreciably different than humid Washington, DC’s 88 F). To appreciate the effect of water on surface heating of land areas, high temperatures in July in bone-dry Death Valley average 117 F.
Getting the surface temperature wrong will have additional consequences for vegetation and agriculture. In general, a wetter U.S. is one of bumper crops and good water supplies out west from winter snows, hardly the picture painted in the National Assessment.
If the government is going to spend time and our money on producing another assessment report, that report should be based on empirical evidence, not climate models. Note that USGCRP is a conglomeration of 13 federal agencies that had a 2016 budget of $2.6 billion for the climate assessment project. Did you get your money’s worth?
Climate modelers make some outlandish predictions, but occasionally there is a glimmer of honesty:
“The forcings that drive long-term climate change are not known with an accuracy sufficient to define future climate change.” — James Hansen, “Climate forcings in the Industrial era”, PNAS, Vol. 95, Issue 22, 12753-12758, October 27, 1998.
“In climate research and modeling, we should recognize that we are dealing with a coupled non-linear chaotic system, and therefore that the prediction of a specific future climate state is not possible.” — Final chapter, Draft TAR 2000 (Third Assessment Report), IPCC.
And remember: “The whole aim of practical politics is to keep the populace alarmed (and hence clamorous to be led to safety) by menacing it with an endless series of hobgoblins, all of them imaginary.” – H. L. Mencken
Some of my ADI articles for background reading:
- A Simple Question for Climate Alarmists
- Evidence that CO2 emissions do not intensify the greenhouse effect
- An examination of the relationship between temperature and carbon dioxide
- Analysis of the National Climate Assessment Report 2014
- Trump, the National Climate Assessment report, and fake news 2017
Note to readers:
- Index with links to all my ADI articles: http://wp.me/P3SUNp-1pi
- My comprehensive 28-page essay on climate change: http://wp.me/P3SUNp-1bq
- A shorter ADI version is at https://arizonadailyindependent.com/2013/08/01/climate-change-in-perspective/
If you like murder mysteries, type the name Lonni Lees (my wife) into Amazon or Barnes & Noble sites to see her novels, a book of short stories, and reviews. For synopses and more reviews of her books see: https://wryheat.wordpress.com/lonnis-murder-mysteries/