

I am a geologist which means I have rocks in my head and some of those rocks have recorded the climate history of Earth. Here is their story.
We will start with the big picture. The graphic below shows the estimated temperature and atmospheric carbon dioxide content for the past 600 million years.
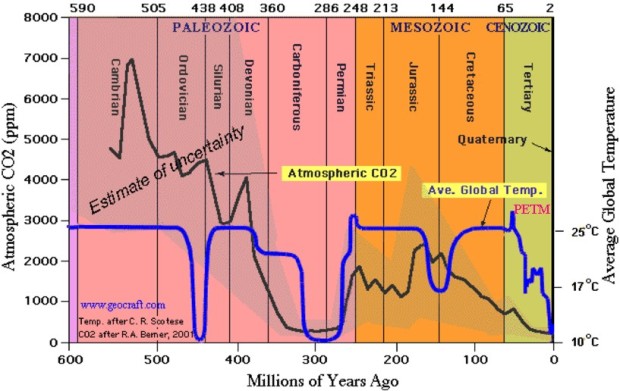
The blue line is the estimated temperature; the black line is estimated carbon dioxide content of the atmosphere.
Notice that for much of the past 600 million years, the temperature has been about 12°C warmer than it is now and life has flourished. (Note that the climate crazies claim that if the global temperature increases by 2°C above present, we will die.)
The dips in the temperature curve are ice ages. Ice ages have occurred on a cycle of about 145 million years. Ice ages consist of glacial epochs and warmer interglacial periods. We are now in an interglacial period. (In the popular vernacular, glacial epochs are often called “ice ages.”) The glacial epoch cycle happens whenever our solar system, in its travels around the center of our galaxy, goes through some spiral arms of the galaxy with very dense clusters of stars which bombard the Earth with more cosmic rays which produce more clouds and other effects in the atmosphere which limit the amount sunlight that gets to Earth’s surface. Cosmic ray flux can be deduced from the so-called cosmogenic nuclides, such as beryllium-10, carbon-14, and chlorine-36, as measured in ancient sediments, trees, shells, and in meteorites.
A general estimate of climate is given by the types of sedimentary rocks deposited, such as limestone, siltstone, shale, sandstone, and glacial deposits. Each type of rock is deposited under certain climatic conditions. Fossils within the rocks give an even better picture.
Another method of estimating temperature is by using oxygen isotopes, a method which is claimed to be able to estimate temperature within one degree. Normal oxygen is O16 with six protons and six neutrons. There is also “heavy” oxygen with eight neutrons. When combined with hydrogen to produce water, each molecule has a different reaction to temperature. The geologic reconstruction of temperature is based on oxygen-18 isotopes from fossils and cave stalagmites.
The amount of carbon dioxide in the atmosphere is also estimated by rock types and especially by fossil leaves. Leaves have pores called stomates whereby the plant takes in carbon dioxide and expels oxygen. If carbon dioxide is abundant, the leaves have fewer and/or smaller stomates than when carbon dioxide is scarcer.
Notice is the graphic above the Carboniferous Period circa 300 million years ago. This was an age when most of Earth’s coal deposits were formed. That sucked up lots of carbon dioxide. Notice that carbon dioxide started to decline about 375 million years ago but temperature decrease of the ice age started about 320 million years ago. Carbon dioxide rose again only after ice-age temperatures warmed the ocean driving some carbon dioxide in the ocean into the atmosphere.
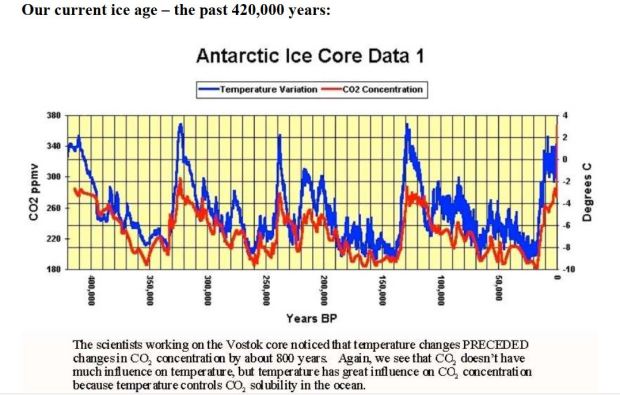
Besides rocks, ice cores also give us some information about climate in our current ice age:
Now let’s take a look at our current interglacial period, called the Holocene, which began about 11,000 years ago.
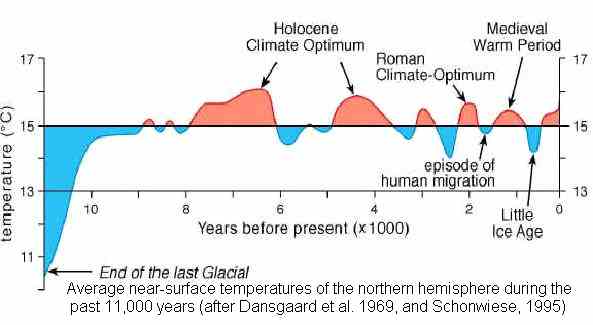
Here, too, we see a temperature fluctuation (recorded by lake-bed sediments and ice cores). The fluctuations are due mainly to several different solar cycles which when combined produce a 1,500-year cycle of warming and cooling. Notice that the magnitude of warm periods are declining with time. Does that mean we are heading for another glacial epoch?
History shows that the cool periods were often times of famine because crops would not sufficiently grow.
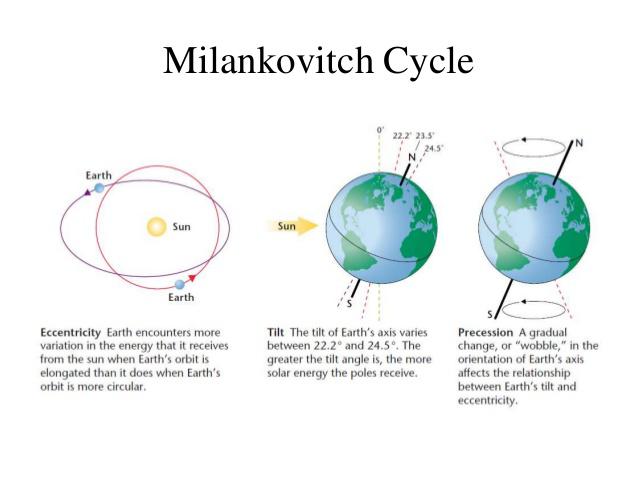
Another influence on climate is the relation of the Earth to the sun. Earth’s orbit around the sun is elliptical which varies in eccentricity. The tilt of Earth’s axis of rotation relative to its orbital plane also varies. These are called Milankovitch Cycles and may be caused by the varying gravitational attraction of the large planets in our solar system. These cycles cause variations in sunlight reaching polar regions.
The climate also changes with position of the continents which control ocean currents. Submarine volcanoes must be considered when evaluating the causes of climate change. Usually, these changes are regional, not global, however they may have global influences such as changing precipitation patterns as seen with the El Niño Southern Oscillation (ENSO).
(See: Huge Volcanic Eruption near Tonga Responsible for Most of Recent Warming
A Note on the “Greenhouse) hypothesis: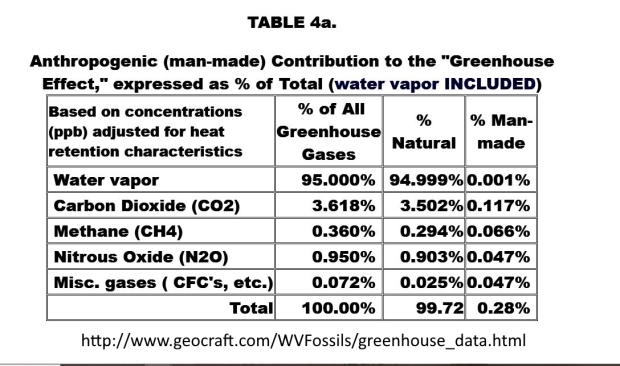
There is much hype about so-called “greenhouse” gases. The “greenhouse” hypothesis deals with heat transfer by conduction and radiation, but completely ignores heat transfer by convection (i.e. wind). As the sun warms the Earth’s surface, heat is reradiated into the atmosphere as a broad spectrum of infrared radiation some of which is captured by greenhouse gases and sent back to the surface. Greenhouse gases don’t really warm the surface, they slow the cooling. Without them, night-time temperatures would drop to freezing.
The table above shows the contribution of each “greenhouse” gas. Water vapor is the principal player. Carbon dioxide from burning fossil fuels comprise only 0.1% of total “greenhouse” gases; methane represents only 0.06%. Neither have any effect on global temperature.